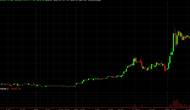
Penny Stock Watchlist 8.5.10. Video is of NCI. Text is BDR WWWW SOLF NBIX BDR Really let me down today. There was a little drop off the open and that was it. So pathetic that this thing couldn’t run for a second day. I won’t give up just yet. I want to see some manipulation […]
Monster pop on DCTH from 7.80 to 8.40. Look to see if it can hold this spike. [wikichart align=”center” ticker=”DCTH” showannotations=”true” livequote=”true” startdate=”04-02-2010″ enddate=”04-08-2010″ width=”570″ height=”365″]
On it’s normal routine of a.m. bounces. Look to see when this fades as it has been in the afternoon sessions. [wikichart align=”center” ticker=”NCI” showannotations=”true” livequote=”true” startdate=”04-02-2010″ enddate=”04-08-2010″ width=”570″ height=”365″]
Up 30% off or rumored buyout talks of 2.40. Featured in today’s watchlist. http://thelincolnlist.com/?p=700 [wikichart align=”center” ticker=”EMMS” showannotations=”true” livequote=”true” startdate=”04-02-2010″ enddate=”04-08-2010″ width=”570″ height=”365″]
Penny Stock Watchlist 8.4.10 Video is BDR. Text is VRML ARNA NCI SOLF EMMS VRML The first 45 minutes of trading were ludicrous. Opens at $12.47, low of 11.85 to a high of 13.50 then down to 11. If it could make noise it would sound like a slot machine. After that VRML was tired […]
No trades on 8.3.10
SOLF has retraced heavy off the 12.25 high. Probably a bit oversold here in the low 11’s. Could be a possible bounce play off these oversold conditions providing it stays above $11. [wikichart align=”center” ticker=”solf” showannotations=”true” livequote=”true” startdate=”03-02-2010″ enddate=”03-08-2010″ width=”570″ height=”365″]
NCI set strong two day support at 9.80 and launched from there. This company is horrid at best but many are choosing to ignore that. I will be looking to short when the parabolic pattern exhausts itself as it did yesterday. [wikichart align=”center” ticker=”NCI” showannotations=”true” livequote=”true” startdate=”03-02-2010″ enddate=”03-08-2010″ width=”570″ height=”365″]
After a gap fill and then a break of the 7.10 area ARNA took off. Not surprising as this stock is predictable under momentum. A little high in the 7.40’s . Be wary of a late day sell off into earnings. Could break out more if it passes 7.50 [wikichart align=”center” ticker=”arna” showannotations=”true” livequote=”true” startdate=”03-02-2010″ […]
NBIX breaking out at hod. Nice turnaround from the 5.75 pivot. 6.25 is top side resistance on the daily chart. If you are not in it long this might not be the best of entries. See if it can hold above 6. [wikichart align=”center” ticker=”NBIX” showannotations=”true” livequote=”true” startdate=”03-02-2010″ enddate=”03-08-2010″ width=”570″ height=”365″]


