

Why Support and Resistance Outweighs All Indicators

75% Win Rate For 2014. Join A Winning Team
Free trial available. Click here to Trade With Us Free
One of the reasons we look at charts in the first place other than the fact that the red and green bars are colorful and cute is because charting allows us to define important price levels on different time frames. I’ve mentioned in the past that many traders will try to over complicate their charting by relying on a multitude of different indicators. Don’t get me wrong extra indicators can help you or reaffirm a trading idea but when it’s all said and done nothing will outweigh the power of support and resistance. The problem that I see so many times, especially with newer traders, is rather than waiting for stock to move above resistance or below support before making a trade they try to guess the direction while the stock is stuck within a tight range. Now sometimes you can get that right but most of the times you will just churn and burn your account and waste commissions.
Today I want to talk about a very nice trade for us on VRTX .Before we go into this lesson though I want to take this opportunity to reference a past lesson done on May 13, 2014 in reference to GMCR. I want to do this because once you see these two charts you will see how similar they are in nature and outcome.
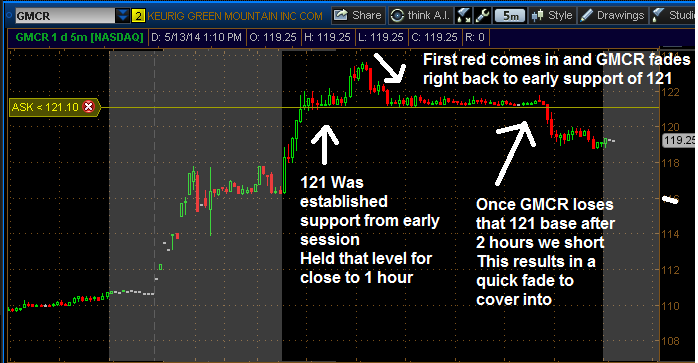
So let’s take a look at the GMCR trade on May 13. You can see from the notes on the chart that once GMCR made its first initial move to the upside the stock rested at $121.00 then proceeded to break out. Roughly an hour later GMCR retests the $121.00 level and spends the entire afternoon bouncing around that number. What that tells us as traders is that for today $121.00 is an significant area of support. For several hours buyers have consistently stepped in and supported the stock at that level. As noted on the chart eventually GMCR and buyers lose control of $121.00 and the stock breaks down. Once that stock had broken down through the $121.00 that was our que to short. To see this entire trade in detail please visit the original post located here
GMCR
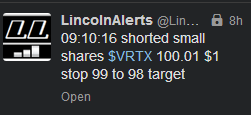
Now let’s take a look at VRTX from today. You can see VRTX pulled the exact same move as GMCR. However, VRTX did the move in premarket rather than normal market hours. If you take a look at the grey shaded area on the chart that highlights pre market activity you see that VRTX gapped up, consolidated at $100.00, broke out of that level, then 30 minutes later retested that $100 and spent approximately the next hour bouncing in and around that number just like GMCR. Taking a page from what we learned in GMCR I made my intentions known to all members that if VRTX were to lose that important $100.00 support level I would short just as I did with GMCR
VRTX Chart
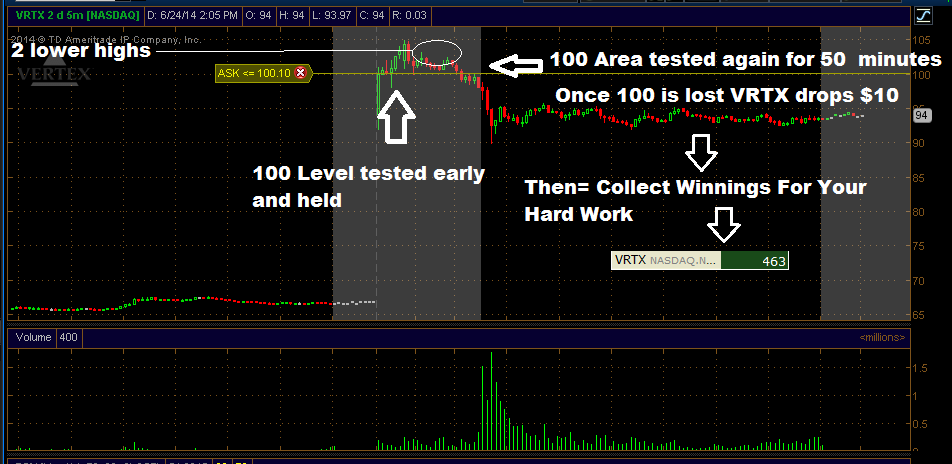
This was a nice score and a great way to start our day. There are not many places you can earn 460 legally in 10 minutes. And as a traders we do this several times a day.
So why do these work? Mainly they work because other traders are trading and making decisions off of these very same numbers. I would wager to think that every long would probably stop out of VRTX if it goes below $100 so therefore you should see a brisk move once it breaks that level. This in my opinion is what makes charting such a beautiful tool for traders. You can see cleanly with your eyes regardless of news, catalysts, PR reports, etc. that $100 is important to the support of this stock and by losing that it changes the bias of the stock significantly, especially when the stock is up over $40 per share. Now this lesson just focused on support and resistance and how simple lines on your chart can define the important locations of buyers and sellers. However, there’s a little extra giveaway with VRTX and that is the two lower highs it made when bouncing off of $100 (highlighted by the circles). Now I will save that lesson for another time.
Keep in mind that the basis for all successful traders is keeping your system and process simple. It’s easy for us to think that the more complex we make it or the more indicators we use or the more thought we put into a trade the better the outcome should be when in fact it’s almost always the opposite.
If training is what you want to do for a living and this is your desired life destiny, learn more about our teachings and trading methods. The easiest way to start is to sign up for our free three day stock trading course, click here to do that. This will give you a great benchmark on how to make solid trading decisions. For those who want to trade for income and wealth enroll in our five-week intensive training course Champ Camp, click here to learn more
Doug
You might enjoy these other posts
5 Things You Must Do To Be Successful
How To Successfully Buy A Terrible Stock
5 Of The Wealthiest Trades In The World