
I must admit, before taking Champ Camp, I struggled in my day trades and made every rookie mistake imaginable. I often traded with improper position size, chased trades off of social media “gurus”, and just did random stuff that I now look back and say to myself, “what was I thinking?”. Soon after, I took Champ Camp and our Trading as an Art DVD. There I learned the art of drawing support and resistance lines that I still use today.
To be honest with you, I was pretty new to day trading back then and had not heard of support and resistance. I soon attended the Champ Camp sessions and that helped tremendously. It wasn’t until I watched the chapter on support and resistance in the DVD that a light bulb turned on. I always tell Doug that the Support and Resistance chapter is golden and it alone is worth hundreds of dollars. I won’t give it all away but what the Support and Resistance chapter did was give me a framework to approach the market and so I began to make it a habit to draw support support and resistance lines all of my stock charts.
What is Support and Resistance?
To touch upon fundamentals, let us go over what is Support and Resistance.
Support – An area of interest where buyers step in.
Resistance– An area of interest where sellers step in.
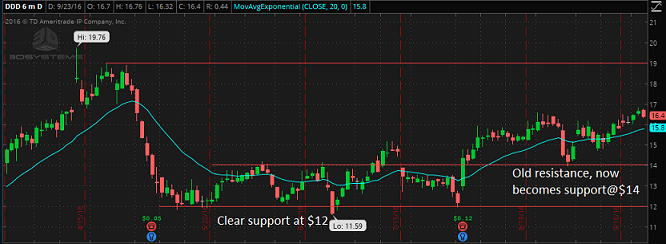
Simple right? Notice I used the term area. This is because support and resistance is not exact. I wouldn’t get too picky about nickels and pennies. You will probably go nuts if you did. The one thing I would focus on is the importance of those levels. To put it simply, the longer the time frame of that level the more important it becomes. Let me explain by asking a question.
If one stock is breaking out intraday on a 5 minute chart and another stock is breaking out on a Daily time frame, which is more important. The second stock right!? A daily breakout/breakdown will always be more important than intraday support and resistance.
How to Identify Support and Resistance
Now, let’s move on to identifying support and resistance and drawing them in our charts. And this is how I do it, there is nothing set in stone that tells day traders how to identify support and resistance. Feel free to use any method that helps you out.
What I like to do is focus on the daily and work my way down to the 5 minute chart.In the example below, I use an hourly chart which is also fine. But I always start with the daily as it gives me the big picture and allows me to jot down some levels before moving on down to a smaller time frame. From here, I focus on the bottom and top of a range. This alone allows me to create a plan. Since I trade while at work, it is important for me to draw these levels on my charts.
Personally, i’m not interested in the stuff that happens in between my lines (levels). I know stock patterns exist and have been around for years, but honestly, I suck at identifying them and have focused solely on support and resistance. And guess what? It has worked perfectly. It is unbelievably simple and reliable.
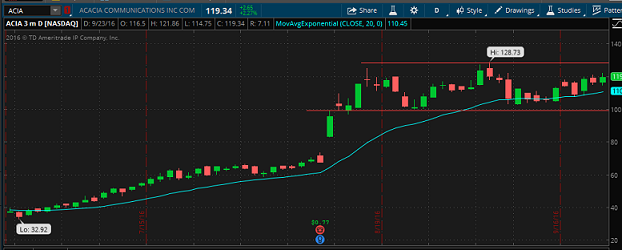
Below is an example of Acacia Commonications (ACIA), a stock that has had a tremendous run. First, start off by drawing support and resistance lines at the bottom and top of the range on the daily.
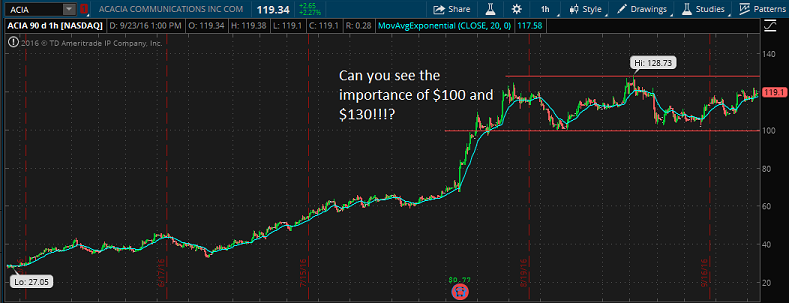
Now, what we want to do, is switch to a smaller timeframe such as 15 minute chart or my favorite, the hourly chart (see below). You can see immediately that now that we have our levels drawn in how important they become. You will also see how much of what goes on is meaningless, at least in my opinion. Personally, i’m not interested until these levels break. But my point is, stocks don’t move randomly. Stocks will trade off these levels almost to the tee.
How to Trade Using Support and Resistance
So now that you have an idea of how to draw in your support and resistance lines, how exactly do you trade using support and resistance? There are 2 trades you can take. For simplicity’s sake, let’s say you plan to buy a stock. Let’s also assume you have your support and resistance drawn in.
The first trade you take is when the stock actually breaks that level. You will often find out this move is pretty quick as it is also taking out stop losses. Think of it as you riding a wave.
The second you can take is what traders call the retest of that resistance. Resistance now becomes support. This is actually a safer trade as you now have a set risk to reward. You could buy that pullback into the new support and at that point the trade works or it doesn’t. Worst case scenario is you take a small loss.